
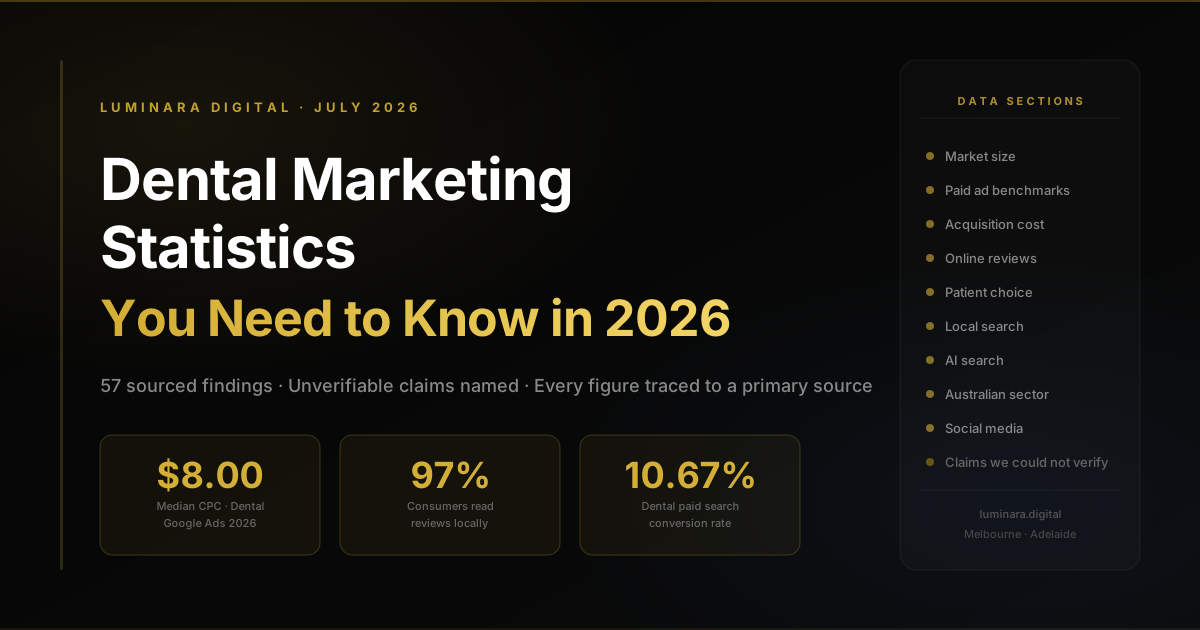
$8.00
median cost per click for dental Google Ads in 2026, 48% above the cross-industry norm (WordStream / LocaliQ, US data)
97%
of consumers read reviews for local businesses (BrightLocal, 2026)
57
findings on this page, each attributed to a named source; 13 widely circulated claims we could not verify are listed separately
01 - Market size & industry spend
Headline numbers for the size of the dental sector and where the money goes.
US$196.1 billion
The size of the US dentists industry in 2026, having grown 1.9% over the year. (Source: IBISWorld, 2026)
The US dentists industry is worth $196.1 billion in 2026, an increase of 1.9% on the previous year.
Source: IBISWorld, 2026
US national dental expenditure reached $189 billion in 2024, representing 3.6% of total health expenditure.
Source: American Dental Association Health Policy Institute, presenting CMS National Health Expenditure data, 2024
Dental spending grew by $7 billion in 2024 - a 4% increase on 2023, inflation-adjusted using the GDP implicit price deflator.
Source: American Dental Association Health Policy Institute, 2024
The average income for US general practice dentists was $215,320 in 2025.
Source: American Dental Association Health Policy Institute, Survey of Dental Practice, 2025
02 - Paid advertising benchmarks
Dental is broken out as its own category in the largest public Google Ads benchmark study, which makes this the most solid data on the page. Figures are medians, not means.
Cost per click
- 2025 report
- $7.85
- 2026 report
- $8.00
- All industries 2026
- $5.42
Click-through rate
- 2025 report
- 5.44%
- 2026 report
- 5.66%
- All industries 2026
- -
Conversion rate
- 2025 report
- 9.08%
- 2026 report
- 10.67%
- All industries 2026
- 8.18%
Cost per lead
- 2025 report
- $83.93
- 2026 report
- $72.97
- All industries 2026
- $66.69
Dental practices paid a median $8.00 per click on search advertising in 2026, against an all-industry median of $5.42 - dental clicks cost roughly 48% more than the cross-industry norm.
Source: WordStream / LocaliQ Google Ads Benchmarks, 2026 - 13,474 US search campaigns, April 2025 to March 2026
Median dental cost per lead fell to $72.97 in 2026, down from $83.93 the previous year - even as cost per click rose. Improved conversion rates absorbed the higher click cost.
Source: WordStream / LocaliQ Google Ads Benchmarks, 2025 and 2026
Dental search conversion rate rose to 10.67% in 2026, from 9.08% in 2025, above the all-industry median of 8.18%.
Source: WordStream / LocaliQ Google Ads Benchmarks, 2026
Median dental search click-through rate was 5.66% in 2026.
Source: WordStream / LocaliQ Google Ads Benchmarks, 2026
On Facebook lead campaigns, dental recorded the highest cost per lead of any industry at $76.71, against an all-industry average of $27.66. Treat with caution: the leads dataset guarantees a minimum of only two active campaigns per subcategory, so this figure may rest on a very small sample.
Source: WordStream Facebook Ads Benchmarks, 2025
03 - Acquisition cost & conversion
What it costs to get a dental enquiry, and how well dental websites turn visitors into bookings.
Dental landing pages convert at a median 4.3%, below the healthcare industry median of 5.1%. Medical treatment pages convert at 5.3% and wellness at 8.2%.
Source: Unbounce Conversion Benchmark Report, 2024 - 41,000+ landing pages, 464 million visitors
The overall median landing page conversion rate across all industries is 6.6%, with industry medians ranging from 3.8% to 12.3%.
Source: Unbounce Conversion Benchmark Report, 2024
43% of patients say they value online booking and rescheduling, 34% say online scheduling matters when evaluating a practice, and 16% would switch providers if a practice lacked it.
Source: Tebra 6th Annual Patient Perspectives Report, 2025 - 3,964 US adults. General healthcare, not dental-specific.
42% of patients named easier appointment booking as the top digital feature they want from a provider.
Source: Tebra 6th Annual Patient Perspectives Report, 2025
As mobile page load time goes from one second to ten seconds, the probability of a visitor bouncing increases 123%.
Source: Think with Google, 2018 - 11 million mobile landing pages across 213 countries. Note the age of this study.
40% of consumers leave a page that takes longer than three seconds to load. Median load times for bounced sessions ran about 2.5 seconds slower than sessions that did not bounce.
Source: Think with Google / SOASTA Research, 2016. Note the age of this study.
04 - Online reviews & reputation
Review behaviour is well-measured for local business generally, and poorly measured for dentistry specifically.
97%
of consumers read reviews for local businesses. (Source: BrightLocal Local Consumer Review Survey, 2026)
97% of consumers read reviews for local businesses, and 41% say they "always" read reviews when searching - up from 29% in 2025.
Source: BrightLocal Local Consumer Review Survey, 2026 - 1,002 US adults
68% of consumers will only use a business rated four stars or higher, and 31% will only use a business rated 4.5 stars or higher.
Source: BrightLocal Local Consumer Review Survey, 2026
80% of consumers say they are likely to use a business that responds to all of its reviews.
Source: BrightLocal Local Consumer Review Survey, 2026
49% of consumers trust online reviews as much as personal recommendations from friends and family. The same survey reported 42% on this measure in 2025, so the trend is not moving in one direction.
Source: BrightLocal Local Consumer Review Survey, 2026
71% of consumers use Google to read local business reviews - down from 83% in 2025. Consumers now consult an average of six different review sites per decision.
Source: BrightLocal Local Consumer Review Survey, 2026
Of 204,751 US dentists listed on Healthgrades, 75.55% had received at least one rating or review. Mean rating was 4.58 for female dentists and 4.57 for male dentists.
Source: Lin et al., Journal of Medical Internet Research, 2020
90% of surveyed patients use online reviews to evaluate physicians, and 71% use reviews as the first step in finding a new provider. 43% would go outside their insurance network for a provider with better reviews.
Source: Software Advice, 2020 - 498 screened patients. Six years old; treat as indicative.
Provider ratings and reviews rank as the number one factor in a healthcare consumer's research phase, ahead of facility ratings and doctor referrals. On average people read 4.7 reviews before choosing a provider, and 64.8% consider reviews over a year old irrelevant.
Source: Press Ganey consumer survey, 2023 - n=1,000. Methodology beyond sample size is not published, and Press Ganey sells reputation products.
05 - How patients choose a dentist
What actually drives the decision, and what keeps people away.
Patients most frequently named the dentist's competence (22.2%), a recommendation from someone they know (20.6%) and overall service quality (19.7%) as their reasons for choosing a dentist. The ranking is the durable finding here, not the decimals.
Source: Grigoroudis et al., Patient Preference and Adherence, 2015 - n=724, Romania, fieldwork 2012
82% of patients rated "cares about my time" as extremely or very important, followed by "dental team is gentle" (79%), "cares about me as a person, not just a patient" (78%) and "has improved my oral health" (78%).
Source: Patient Experience and Expectations in Oral Health Care, International Dental Journal, 2024 - n=400, USA
84% of patients reported satisfaction with their dental office, driven by good customer service (48%) and quality of care (42%).
Source: International Dental Journal, 2024
Global prevalence of dental fear and anxiety in adults is estimated at 15.3%, with high dental fear at 12.4% and severe dental fear at 3.3%. Prevalence is higher among women and younger adults.
Source: Silveira et al., Journal of Dentistry, 2021 - systematic review, 31 studies, 72,577 individuals
Among US adults aged 19–64, 53% with private dental insurance had at least one dental visit in 2023, compared with 24% on public insurance and 16% with no dental cover.
Source: American Dental Association Health Policy Institute, 2023
06 - Local search behaviour
Almost every famous local SEO statistic failed verification. What remains is survey data from one organisation - solid, but self-reported rather than measured.
52% of consumers used Google Search as the first channel in their most recent local business search, with 9% starting in Google Maps and 9% on social media.
Source: BrightLocal Consumer Search Behavior, 2026 - 1,227 US consumers
73% of local business searches were conducted on a mobile phone, against 19% on computers and 8% on tablets.
Source: BrightLocal Consumer Search Behavior, 2026
75% of consumers used more than one channel during their most recent local search, and 71% used Google Search at some point in the journey.
Source: BrightLocal Consumer Search Behavior, 2026
45% of consumers default to Google for local searches, and 15% use Google Maps as their primary local search platform.
Source: BrightLocal Consumer Search Behavior Study, 2025 - 1,000 US adults
07 - AI search & healthcare discovery
The best-measured area on this page, and the one where credible sources most openly disagree.
Google users clicked a traditional search result on 8% of visits to pages carrying an AI summary, versus 15% on pages without one.
Source: Pew Research Center, 2025 - real browsing data from 900 US adults across 68,879 searches, March 2025
Users clicked a link inside the AI summary itself on just 1% of visits. This is the origin of the widely repeated "1% AI Overview click-through rate".
Source: Pew Research Center, 2025
Users ended their session entirely on 26% of visits to pages with an AI summary, against 16% for pages with only traditional results.
Source: Pew Research Center, 2025
AI Overviews triggered on 6.49% of queries in January 2025, peaked at 24.61% in July 2025, then fell to 15.69% by November 2025. Any AI-search statistic dated mid-2025 overstates the current picture.
Source: Semrush, 2025 - 10 million+ keywords, clickstream data
32% of US adults have used AI chatbots for health information in the past year, with 29% seeking physical health information and 16% mental health information.
Source: KFF Tracking Poll on Health Information and Trust, 2026 - 1,343 US adults, ±3pp margin of error
41% of people who used AI chatbots for health information uploaded personal medical information to them, while 77% of the public express concern about the privacy of medical data shared with AI.
Source: KFF Tracking Poll on Health Information and Trust, 2026
45% of consumers have used AI tools to find local business recommendations in the past year, up from 6% in 2025. ChatGPT leads at 31% usage, Google AI Mode at 23%. The size of that jump rests on self-reported recall - treat the magnitude cautiously even though the direction is corroborated elsewhere.
Source: BrightLocal Local Consumer Review Survey, 2026
23% of consumers used AI during their most recent local business search - but only 2% relied on AI alone, and 43% went on to check Google afterwards. AI is so far additive to search, not a replacement for it.
Source: BrightLocal Consumer Search Behavior, 2026
Among consumers who use AI for local recommendations, 63% trust those recommendations and 88% fact-check them by verifying legitimacy (51%) or checking sources (37%). Note this is measured among AI users only, not the general population.
Source: BrightLocal Local Consumer Review Survey, 2026 - base of 455 AI users
68.01% of Google searches ended without a click in 2026, compared with approximately 45% ten years earlier. This counts all searches with no external click, including refinements and abandoned sessions - not only AI-driven ones.
Source: Similarweb, 2026
08 - The Australian dental sector
Australia has genuinely excellent public data on workforce and access - better than the US on some measures - and almost none on marketing.
Australia had around 27,100 registered dental practitioners in 2023, up from around 21,000 in 2014. Registered dentists specifically rose from around 15,800 to around 20,300 over the same period.
Source: Australian Institute of Health and Welfare, 2023
There were 61.1 full-time equivalent dentists per 100,000 population in 2023, down from 62.0 in 2022 - ranging from 68.7 in the ACT to 34.2 in the Northern Territory, and from 68.3 in major cities to 21.4 in remote areas.
Source: Australian Institute of Health and Welfare, 2023
About 84% of employed Australian dentists worked in private practice in 2023, with around 10,000 in group practices and around 4,900 in solo practices.
Source: Australian Institute of Health and Welfare, 2023
Around 9.5% of employed Australian dentists were specialists in 2023. Orthodontists were the largest specialist group at 572, about 34% of all dental specialists.
Source: Australian Institute of Health and Welfare, 2023
Half of employed Australian dentists worked part-time in 2023, 48% were female, and 27% qualified outside Australia and New Zealand.
Source: Australian Institute of Health and Welfare, 2023
53.9% of Australians saw a dental professional in 2024–25, up from 53.2% the previous year - ranging from 64.9% in the least disadvantaged areas to 42.1% in the most disadvantaged.
Source: Australian Bureau of Statistics, Patient Experiences, 2024–25
25.2% of Australians delayed or did not see a dental professional when needed in 2024–25, down from 28.0% the previous year. This rose to 34.1% in the most disadvantaged areas against 18.5% in the least.
Source: Australian Bureau of Statistics, Patient Experiences, 2024–25
16.1% of Australians delayed or avoided dental care specifically due to cost in 2024–25, down from 17.6%. Cost was a barrier for 23.1% in the most disadvantaged areas against 9.6% in the least.
Source: Australian Bureau of Statistics, Patient Experiences, 2024–25
Total Australian dental expenditure was $11.1 billion in 2020–21, 7.4% of total allocated disease expenditure, up from $8.3 billion in 2011–12.
Source: Australian Institute of Health and Welfare, Disease Expenditure Study, 2020–21
The Australian dental services market is estimated at $15.2 billion in 2026, up 1.5%, having grown at a 2.3% compound annual rate since 2021.
Source: IBISWorld, 2026 - commercial estimate, includes public sector activity
There were 20,919 dental services businesses in Australia in 2026, up 3.1% on 2025. Note this counts businesses, not clinic locations.
Source: IBISWorld, 2026 - commercial estimate
09 - Social media in dentistry
This is the thinnest section on the page, and we would rather say so than pad it.
Australia had 21.0 million social media user identities in October 2025 - 77.7% of the population. Note these are accounts, not people.
Source: DataReportal, Digital 2026: Australia
26.2 million Australians used the internet at the end of 2025, a penetration rate of 97.1%.
Source: DataReportal, Digital 2026: Australia
67.5% of surveyed dental practitioners said they use social media in their practice, with 72.1% citing oral health promotion, 62.3% connecting with patients and 56.6% marketing.
Source: JMIR Formative Research, 2025 - n=265, Philippines. Not generalisable to Australian practices.
84% of US adults use YouTube and 71% use Facebook; 37% use TikTok, 32% WhatsApp and 26% Reddit.
Source: Pew Research Center, Americans' Social Media Use, 2025 - 5,022 US adults. United States only.
10 - What we could not verify
We think this is the most useful section on the page. These statistics circulate constantly in dental marketing content. We tried to verify each one and failed. If you see them quoted, treat them as unsupported.
"Practices should spend 4–7% of gross revenue on marketing"
- Why we rejected it
- Traces only to agency blogs citing no survey or methodology.
"Average dental patient lifetime value is $5,000–$10,000"
- Why we rejected it
- No citation anywhere. Every version appears in vendor content.
"1 in 3 calls to dental practices goes unanswered"
- Why we rejected it
- We fetched the page cited as its origin. It names no source for any of its figures.
"53% of mobile users abandon sites taking over 3 seconds"
- Why we rejected it
- Not present on the Google page it is attributed to, which says 40%.
"88% of consumers trust online reviews as much as personal recommendations"
- Why we rejected it
- Untraceable. The verifiable current figure is 49% (BrightLocal, 2026).
"46% of all Google searches are local"
- Why we rejected it
- Recycled between blogs for years with no reachable primary source.
"Near-me searches grew 900%"
- Why we rejected it
- No primary source reachable.
"76% of people who search nearby visit a business within 24 hours"
- Why we rejected it
- No primary source reachable.
Local map-pack click-through rates (44%, 17.8%)
- Why we rejected it
- Trace to an untraceable source from around 2018.
"81% of new dental patients rely on Google"
- Why we rejected it
- Attributed to BrightLocal but absent from the survey.
"Each additional star is worth 5–9% revenue" (attributed to Harvard)
- Why we rejected it
- Untraceable as cited.
"68% of patients prefer online booking"
- Why we rejected it
- Untraceable. The verifiable figure is 43% (Tebra, 2025).
"300–500 reviews doubles call volume"
- Why we rejected it
- Vendor blog claim, no underlying data.
We also discarded figures from Grand View Research (the site blocked automated access, so market-size figures remain unverified), APRA private health insurance dental coverage percentages (published only inside dashboards we could not read), and CDC dental visit data (the server refused every request). These may well be accurate - we simply could not confirm them, so we have not published them. Source organisations: Ahrefs, American Dental Association Health Policy Institute, Australian Bureau of Statistics, Australian Institute of Health and Welfare, BrightLocal, DataReportal, IBISWorld, International Dental Journal, Journal of Dentistry, Journal of Medical Internet Research, KFF, Pew Research Center, Press Ganey, Semrush, Similarweb, Software Advice, Tebra, Think with Google, Unbounce, WordStream / LocaliQ.
Conclusion
Dental marketing in 2026 is measurable, competitive, and increasingly expensive to get wrong. The benchmarks on this page - $8.00 median cost per click, 10.67% paid-search conversion rate, 97% of consumers reading reviews for local businesses, 25.2% of Australians delaying dental care - give you a real-world baseline to audit your current spend and positioning against. The claims we could not verify are equally important: the dental marketing space is filled with unsourced numbers that agencies repeat without checking. If a benchmark you've been given doesn't name a study, a sample size, and a year, treat it as noise. At Luminara Digital, we run Google Ads and SEO for dental clinics, with ads and landing pages reviewed against Ahpra advertising guidelines before launch. If you want to know how your clinic's numbers compare to the verified benchmarks on this page, book a free 30-minute review.
Common questions
The median cost per click for the Dentists & Dental Services category was $8.00 in 2026, up from $7.85 in 2025, against an all-industry median of $5.42. Dental clicks cost roughly 48% more than the cross-industry norm. Source: WordStream / LocaliQ Google Ads Benchmarks 2026, based on 13,474 US search campaigns from April 2025 to March 2026.
The median cost per lead for dental search advertising was $72.97 in 2026, down from $83.93 in 2025. Cost per click rose over the same period, so the improvement came from a higher conversion rate rather than cheaper traffic. Source: WordStream / LocaliQ Google Ads Benchmarks.
Dental landing pages convert at a median 4.3%, below the healthcare industry median of 5.1%. Source: Unbounce Conversion Benchmark Report 2024, based on over 41,000 landing pages. Note this is a different measure from paid-search click-to-lead conversion, which was 10.67% for dental in 2026 - those two figures measure completely different things and should not be compared directly.
16.1% of Australians delayed or did not see a dental professional due to cost in 2024–25, down from 17.6% the previous year. This figure rises to 23.1% in the most disadvantaged areas. Source: Australian Bureau of Statistics, Patient Experiences 2024–25. Note: the ADA's Dental Health Week survey reported a higher figure of 61% delaying treatment, but this comes from an awareness campaign with no published sampling methodology.
The evidence is genuinely contested. Pew Research Center found users clicked a traditional result on 8% of visits to pages with an AI summary versus 15% without one. Ahrefs reports a 58% reduction in position-one click-through rate. However Semrush, comparing the same keywords before and after AI Overviews appeared, found zero-click rates actually fell slightly. Both Ahrefs and Semrush are vendors with commercial interests in opposite conclusions - anyone citing only one is telling half the story.
There is no trustworthy public benchmark. The commonly quoted figures of 4–7% of gross revenue trace only to agency blog posts that cite no survey, sample or methodology. Any spend benchmark you see quoted should be treated as unsupported unless a named study with a sample size and year is attached.
68% of consumers will only use a business rated four stars or higher, and 31% require 4.5 stars or higher. 80% of consumers say they are likely to use a business that responds to all of its reviews. Source: BrightLocal Local Consumer Review Survey, 2026 - 1,002 US adults.
Tags: Dental MarketingGoogle AdsLocal SEOAI SearchAustralian DentalPatient AcquisitionOnline Reviews